当前位置 : 首页 » 文章分类 : » ECharts
ECharts
ECharts 使用笔记
ECharts,一个使用 JavaScript 实现的开源可视化库,可以流畅的运行在 PC 和移动设备上,兼容当前绝大部分浏览器(IE8/9/10/11,Chrome,Firefox,Safari等),底层依赖矢量图形库 ZRender,提供直观,交互丰富,可高度个性化定制的数据可视化图表。
ECharts 最初由百度前端技术团队开发,现已进入 Apache 软件基金会孵化。
ECharts - Apache
https://echarts.apache.org/zh/index.html
apache / incubator-echarts
https://github.com/apache/incubator-echarts
特性 - ECharts
https://echarts.apache.org/zh/feature.html
官方实例 - ECharts
https://echarts.apache.org/examples/zh/index.html
下载 ECharts
在 GitHub 页面下载最新 Release 版本
https://github.com/apache/incubator-echarts/releases
JavaScript 引入
在解压后的 dist 目录中找到压缩版 echarts.min.js
header 中引入
<!DOCTYPE html>
<html>
<head>
    <meta charset="utf-8">
    <!-- 引入 ECharts 文件 -->
    <script src="echarts.min.js"></script>
</head>
</html>
折线图
在页面画两个 div 作为图表容器,注意必须指明宽度和高度,否则无法初始化
<div id="echarts_pv" style="width:100%;height:400px;"></div>
<div id="echarts_ip" style="width:100%;height:400px;"></div>
js 使用 ECharts 写入数据
<script type="text/javascript">
    // 基于准备好的dom,初始化echarts实例
    var myChartPV = echarts.init(document.getElementById('echarts_pv'));
    var myChartIP = echarts.init(document.getElementById('echarts_ip'));

    // 指定图表的配置项和数据
    var optionPV = {
      title: {
       text: '页面访问量'
      },
      legend: {
        data: ['masikkk.com', 'devgou.com', 'madaimeng.com', 'localhost:4000']
      },
      xAxis: {
          type: 'category',
          data: ['2020-02-28', '2020-02-28', '2020-02-28', '2020-02-28', '2020-02-28', '2020-02-28', '2020-02-28']
      },
      yAxis: {
          type: 'value'
      },
      toolbox: {
        feature: {
          saveAsImage: {}
        }
      },
      series: [{
          name: 'masikkk.com',
          data: [82, 93, 90, 93, 129, 133, 132],
          type: 'line'
      },{
          name: 'devgou.com',
          data: [40, 52, 31, 44, 90, 30, 50],
          type: 'line'
      },{
          name: 'madaimeng.com',
          data: [38, 39, 39, 29, 30, 50, 70],
          type: 'line'
      },{
          name: 'localhost:4000',
          data: [21, 12, 21, 34, 20, 30, 20],
          type: 'line'
      }]
    };

    var optionIP = {
      title: {
       text: 'IP数'
      },
      legend: {
        data: ['masikkk.com', 'devgou.com', 'madaimeng.com', 'localhost:4000']
      },
      xAxis: {
          type: 'category',
          data: ['2020-02-28', '2020-02-28', '2020-02-28', '2020-02-28', '2020-02-28', '2020-02-28', '2020-02-28']
      },
      yAxis: {
          type: 'value'
      },
      toolbox: {
        feature: {
          saveAsImage: {}
        }
      },
      series: [{
          name: 'masikkk.com',
          data: [82, 93, 90, 93, 129, 133, 132],
          type: 'line'
      },{
          name: 'devgou.com',
          data: [40, 52, 31, 44, 90, 30, 50],
          type: 'line'
      },{
          name: 'madaimeng.com',
          data: [38, 39, 39, 29, 30, 50, 70],
          type: 'line'
      },{
          name: 'localhost:4000',
          data: [21, 12, 21, 34, 20, 30, 20],
          type: 'line'
      }]
    };

    // 使用刚指定的配置项和数据显示图表。
    myChartPV.setOption(optionPV);
    myChartIP.setOption(optionIP);
</script>
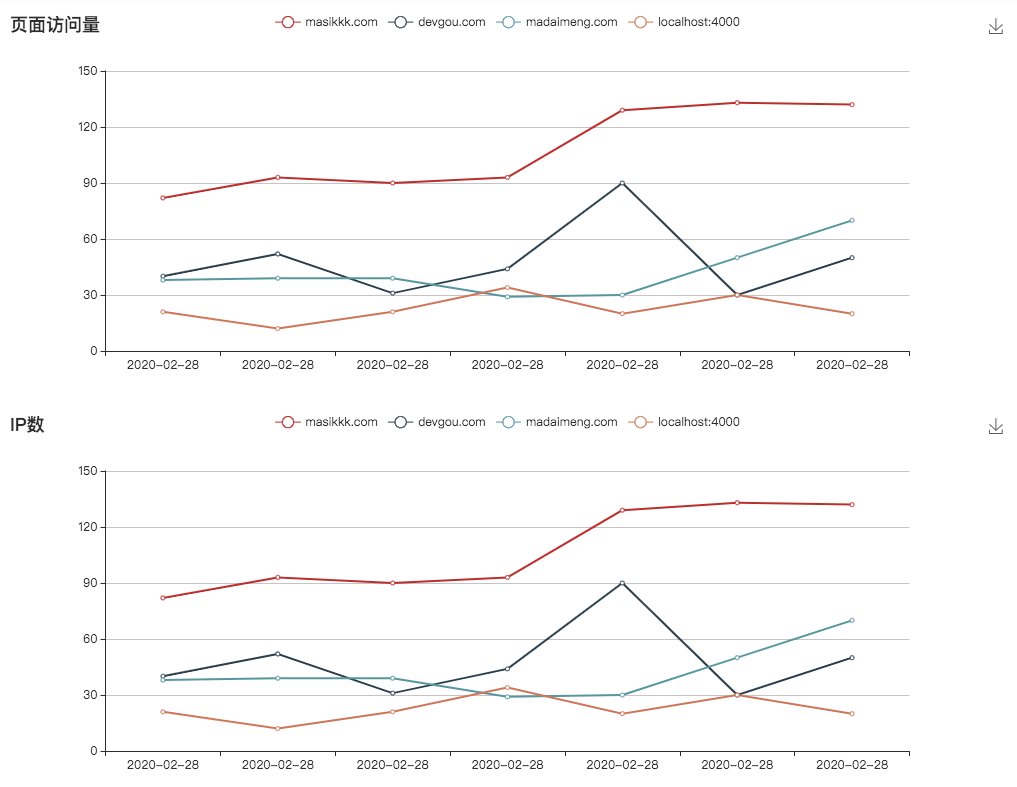
结果如下图

ECharts折线图示例
磁盘占用矩形树图
https://echarts.apache.org/examples/zh/editor.html?c=treemap-disk
动态数据
本地拼装一个 data json,模拟后端返回的数据,根据 json 数据绘制图表
<script type="text/javascript">
    // 基于准备好的dom,初始化echarts实例
    var myChartPV = echarts.init(document.getElementById("echarts_pv"));
    var myChartIP = echarts.init(document.getElementById("echarts_ip"));

    // 图表数据json
    var data = {
      "pv": {
        "date": ["2020-02-28", "2020-02-28", "2020-02-28", "2020-02-28", "2020-02-28", "2020-02-28", "2020-02-28"],
        "domain_map": {
          "masikkk.com": [82, 93, 90, 93, 129, 133, 132],
          "devgou.com": [40, 52, 31, 44, 90, 30, 50],
          "madaimeng.com": [38, 39, 39, 29, 30, 50, 70],
          "localhost:4000": [21, 12, 21, 34, 20, 30, 20]
        }
      },
      "ip": {
        "date": ["2020-02-28", "2020-02-28", "2020-02-28", "2020-02-28", "2020-02-28", "2020-02-28", "2020-02-28"],
        "domain_map": {
          "masikkk.com": [82, 93, 90, 93, 129, 133, 132],
          "devgou.com": [40, 52, 31, 44, 90, 30, 50],
          "madaimeng.com": [38, 39, 39, 29, 30, 50, 70],
          "localhost:4000": [21, 12, 21, 34, 20, 30, 20]
        }
      }
    }

    // 根据图表数据json拼装图表字段
    var pvLegend = [];
    var pvSeries = [];
    $.each(data.pv.domain_map, function(key, value) {
      var item = {};
      item.type = "line";
      item.name = key;
      item.data = value;
      pvSeries.push(item);
      pvLegend.push(key);
    });

    var ipLegend = [];
    var ipSeries = [];
    $.each(data.ip.domain_map, function(key, value) {
      var item = {};
      item.type = "line";
      item.name = key;
      item.data = value;
      ipSeries.push(item);
      ipLegend.push(key);
    });

    // 指定图表的配置项和数据
    var optionPV = {
      title: {
       text: "页面访问量"
      },
      legend: {
        // 图例,动态数据
        data: pvLegend
      },
      xAxis: {
          type: "category",
          // 横轴,动态数据
          data: data.pv.date
      },
      yAxis: {
          type: "value"
      },
      toolbox: {
        feature: {
          saveAsImage: {}
        }
      },
      // 动态数据
      series: pvSeries
    };

    var optionIP = {
      title: {
       text: "IP数"
      },
      legend: {
        // 图例,动态数据
        data: ipLegend
      },
      xAxis: {
          type: "category",
          // 横轴,动态数据
          data: data.ip.date
      },
      yAxis: {
          type: "value"
      },
      toolbox: {
        feature: {
          saveAsImage: {}
        }
      },
      // 动态数据
      series: ipSeries
    };

    // 使用刚指定的配置项和数据显示图表。
    myChartPV.setOption(optionPV);
    myChartIP.setOption(optionIP);
</script>
上一篇 Hexo博客(29)ECharts图表展示网站访问量
下一篇 LeetCode.034.Find First and Last Position of Element in Sorted Array 在排序数组中查找元素的第一个和最后一个位置
页面信息
location:protocol: host: hostname: origin: pathname: href: document:referrer: navigator:platform: userAgent: